Research Terminal
A central member workspace connecting current intelligence, published research and QTL resources.
QTL combines AI-assisted research, quantitative methods, documented backtests and reproducible workflows to help traders investigate markets with far more structure than traditional retail education.
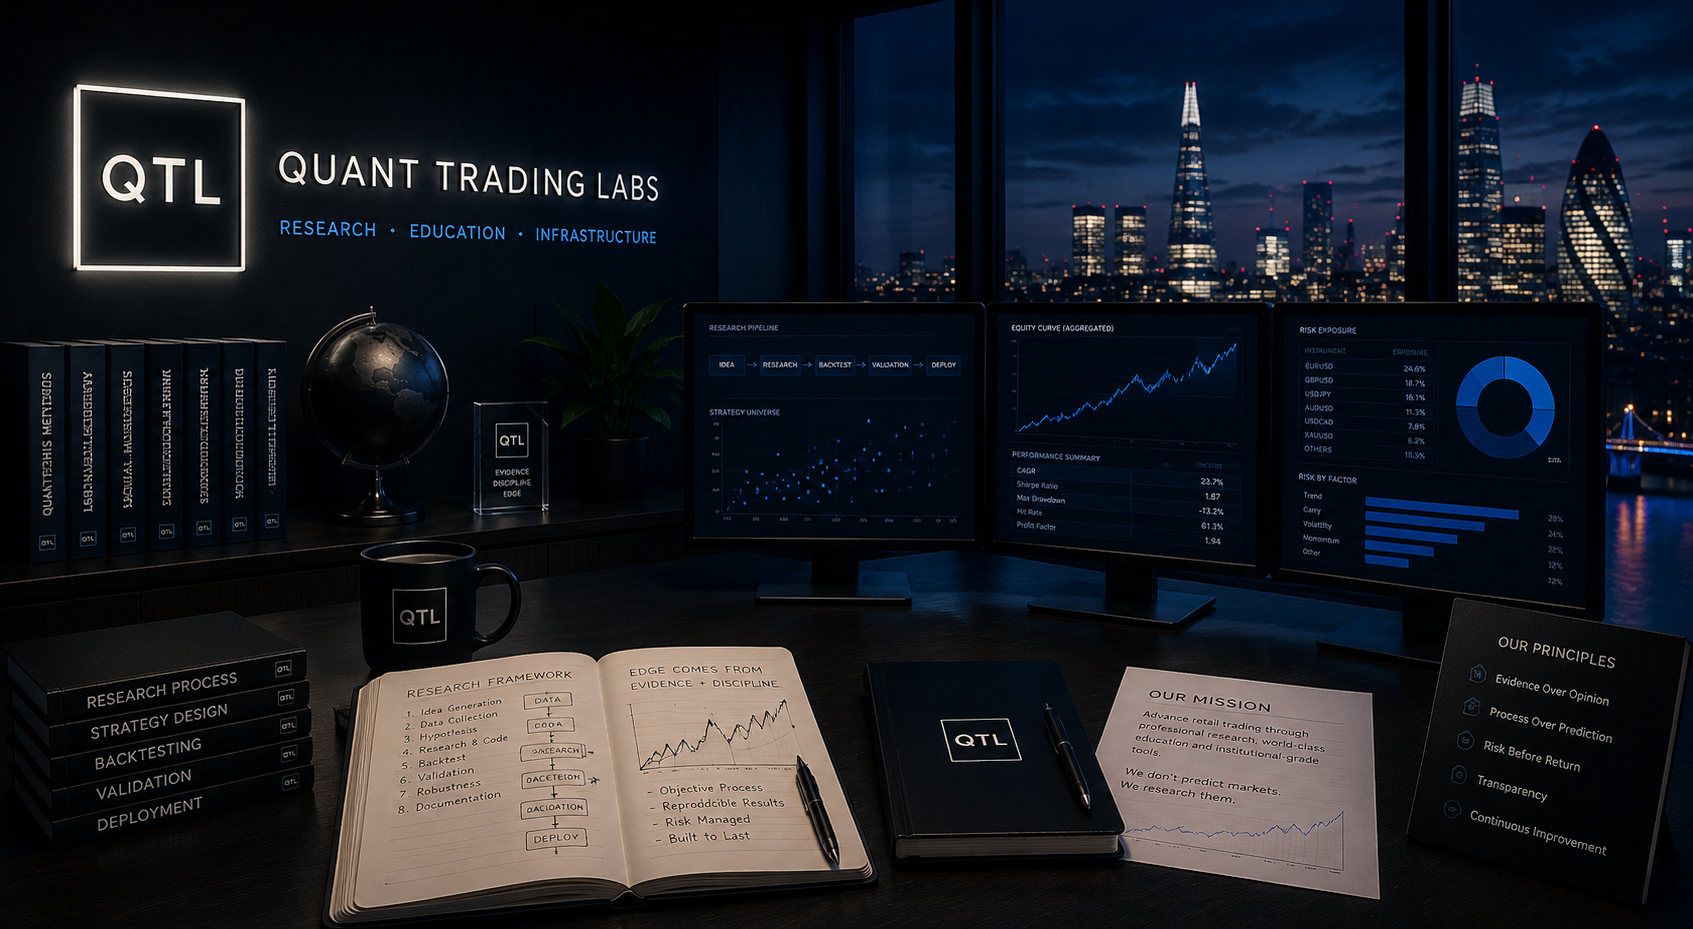
Every research project follows a structured path designed to turn ideas into evidence rather than opinions into marketing.
We begin with a market observation, behaviour or research idea worth investigating.
We examine the theory, literature, market structure and relevant quantitative evidence.
The research question is translated into reproducible Python and structured test logic.
Historical behaviour is tested with explicit assumptions, transaction costs and controls.
Results are challenged through robustness work, drawdown analysis and limitations review.
The evidence, methodology, code and limitations are documented for members to study.
Membership connects current market intelligence, published strategies, research methodology, AI workflows, implementation resources and ongoing updates inside one platform.
A central member workspace connecting current intelligence, published research and QTL resources.
Structured market intelligence covering regime, volatility, macro context and active research observations.
Published quantitative strategies, historical evidence, validation material and ongoing research updates.
A structured guide to researching, coding, backtesting, validating and deploying quantitative ideas.
Structured AI prompts designed for research, coding, analysis, validation and deployment workflows.
Members receive the research context and implementation code behind published QTL strategy work.
AI lowers the technical barrier. It does not lower the research standard.
ChatGPT and other LLMs can help explain unfamiliar concepts, generate and debug Python, interrogate results and translate plain-English questions into structured quantitative workflows.
AI gives you leverage. Research gives you an edge.
Can you show me how to build and test a moving-average crossover without assuming I already know Python?
import pandas as pd

fast = data["close"].rolling(20).mean()
slow = data["close"].rolling(50).mean()

signal = (fast > slow).astype(int)

# Next:
# 1. define entries
# 2. apply transaction costs
# 3. calculate returns
# 4. validate out-of-sample
Published strategy research is accompanied by documented assumptions, historical evidence, equity curves, drawdown behaviour, risk metrics and the limitations required to understand what the results actually represent.
Historical research simulation · Jan 2020 – Mar 2026
Historical research simulation derived from the underlying 1,124-trade FlipBB research log using fixed £1-per-pip sizing from £10,000 starting capital. Position sizing materially affects monetary returns and drawdowns. Historical or simulated performance does not predict future results.
Historical treasury research · Jan 2021 – Mar 2026
Historical OS1 treasury-ledger backtest results. Historical or simulated performance is not live realised performance and does not predict future results.
We do not sell trade entries, exits or alerts.
We do not promise profits, forecasts or risk-free outcomes.
Research assumptions, evidence and limitations are documented rather than hidden.
AI is used inside structured research workflows rather than as a shortcut to unsupported answers.
The emphasis is on working research, evidence, code and repeatable process.
Membership is not access to a static course. It is access to an evolving research environment designed to grow as new work is published.
Annual membership unlocks the Research Terminal, published strategy research, source code, member publications, governed AI prompts, Daily Quant Brief and ongoing strategy updates.
Annual membership · Research and educational content only