Documented Assumptions
Every backtest states its data window, transaction-cost model, slippage assumptions and any survivorship or lookahead controls.
Six principles govern every publication we release, from data integrity and statistical validation to limitations and reproducible code.
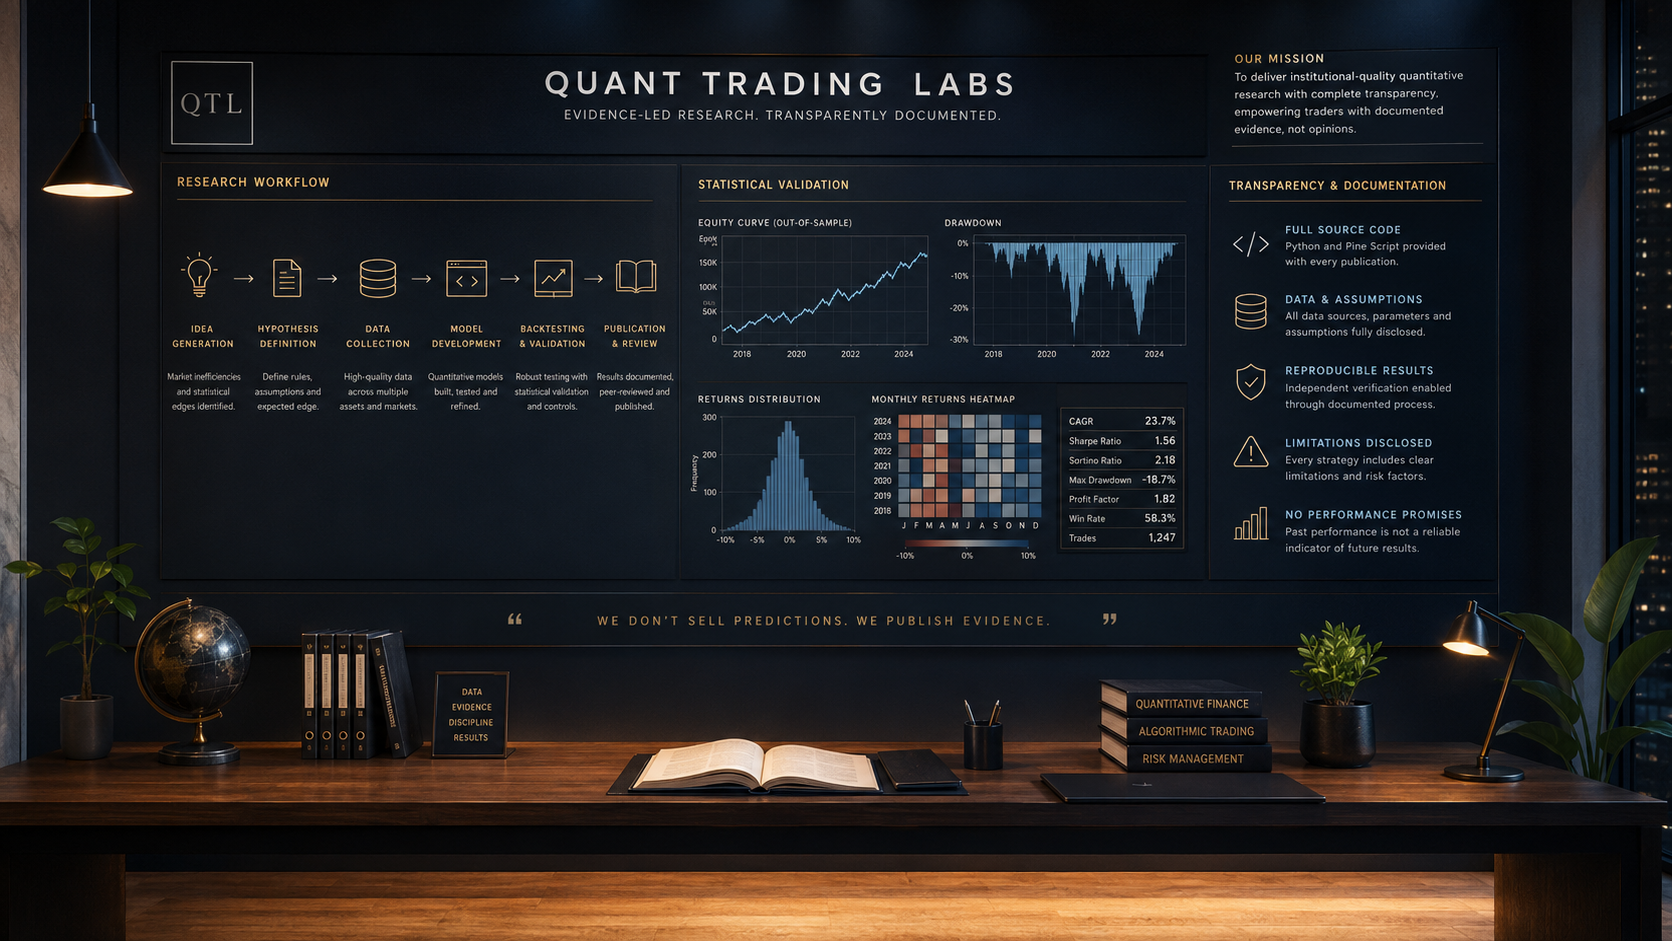
Our methodology is designed to make every published strategy easier to understand, reproduce, challenge and evaluate independently.
Every backtest states its data window, transaction-cost model, slippage assumptions and any survivorship or lookahead controls.
Complete research and implementation code is included where applicable so members can study how the published results were produced.
CAGR, Sharpe, Sortino, maximum drawdown, profit factor and win rate are reported consistently across published strategy research.
Where practical we discuss walk-forward behaviour, parameter sensitivity, regime dependence and the limits of the historical evidence.
Every dossier includes limitations and conditions under which the strategy may not be expected to behave as historical research suggests.
Historical and hypothetical results are always distinguished from live outcomes. Past performance is not a reliable indicator of future results.
Published QTL strategies are accompanied by historical trade logs, equity curves, drawdown analysis, risk-adjusted metrics and documented assumptions.
The objective is not to present a headline return in isolation. It is to preserve enough evidence for the research to be examined, challenged and understood.
Strategy results are reviewed against underlying trade or accounting records before being presented as published QTL research.
Systematic FX research built around first-flip behaviour, checkpointed path analysis and controlled trade management.
Historical peak-to-trough decline through the test period.
Historical research simulation derived from the underlying 1,124-trade FlipBB research log using fixed £1-per-pip sizing from £10,000 starting capital. Position sizing materially affects monetary returns and drawdowns. Historical or simulated performance does not predict future results.
Multi-layer quantitative research framework combining strategy selection, portfolio construction, drawdown-aware capital allocation and treasury management.
Historical peak-to-trough decline through the test period.
Historical OS1 treasury-ledger backtest results. Historical or simulated performance is not live realised performance and does not predict future results.
Historical and simulated results are research outputs only. Past performance is not a reliable indicator of future results.
Public pages show evidence and selected performance results. Membership unlocks the complete body of research that produced them.
Methodology, assumptions, validation, limitations and supporting research.
Research and implementation code supporting published strategy work.
Trade logs, equity curves, drawdown analysis and robustness outputs.
The structured framework used to turn observations into reproducible evidence.
Operational constraints, deployment logic and risk-management considerations.
Subsequent strategy observations and research updates alongside the original work.
Join QTL to access published strategy research, source code, backtest evidence, methodology resources and ongoing strategy updates.
Annual membership